So I missed posting last week’s math warm-ups because my phone has decided not to talk to my computer (which, I believe is a ruse to make me finally give in and get an iPhone–everything else I use is Apple anyway, so I guess it only makes sense…) so I can’t show you the pictures I took.
Well, it seems that wasn’t so big of a deal anyway, because there have been lots of math activities (not just warm-ups) that have been related to data collection, and this way I can connect them all. Bonus. 🙂
We began several weeks ago, as I knew we’d be launching into a unit on data collection and analysis, to try our hand at some easy surveys in our math warm-ups. We talked with the very first one about the idea that we’ll be collecting, organizing and analyzing data (and what all of those things mean). Then we spent many days answering survey questions, and doing just those things:
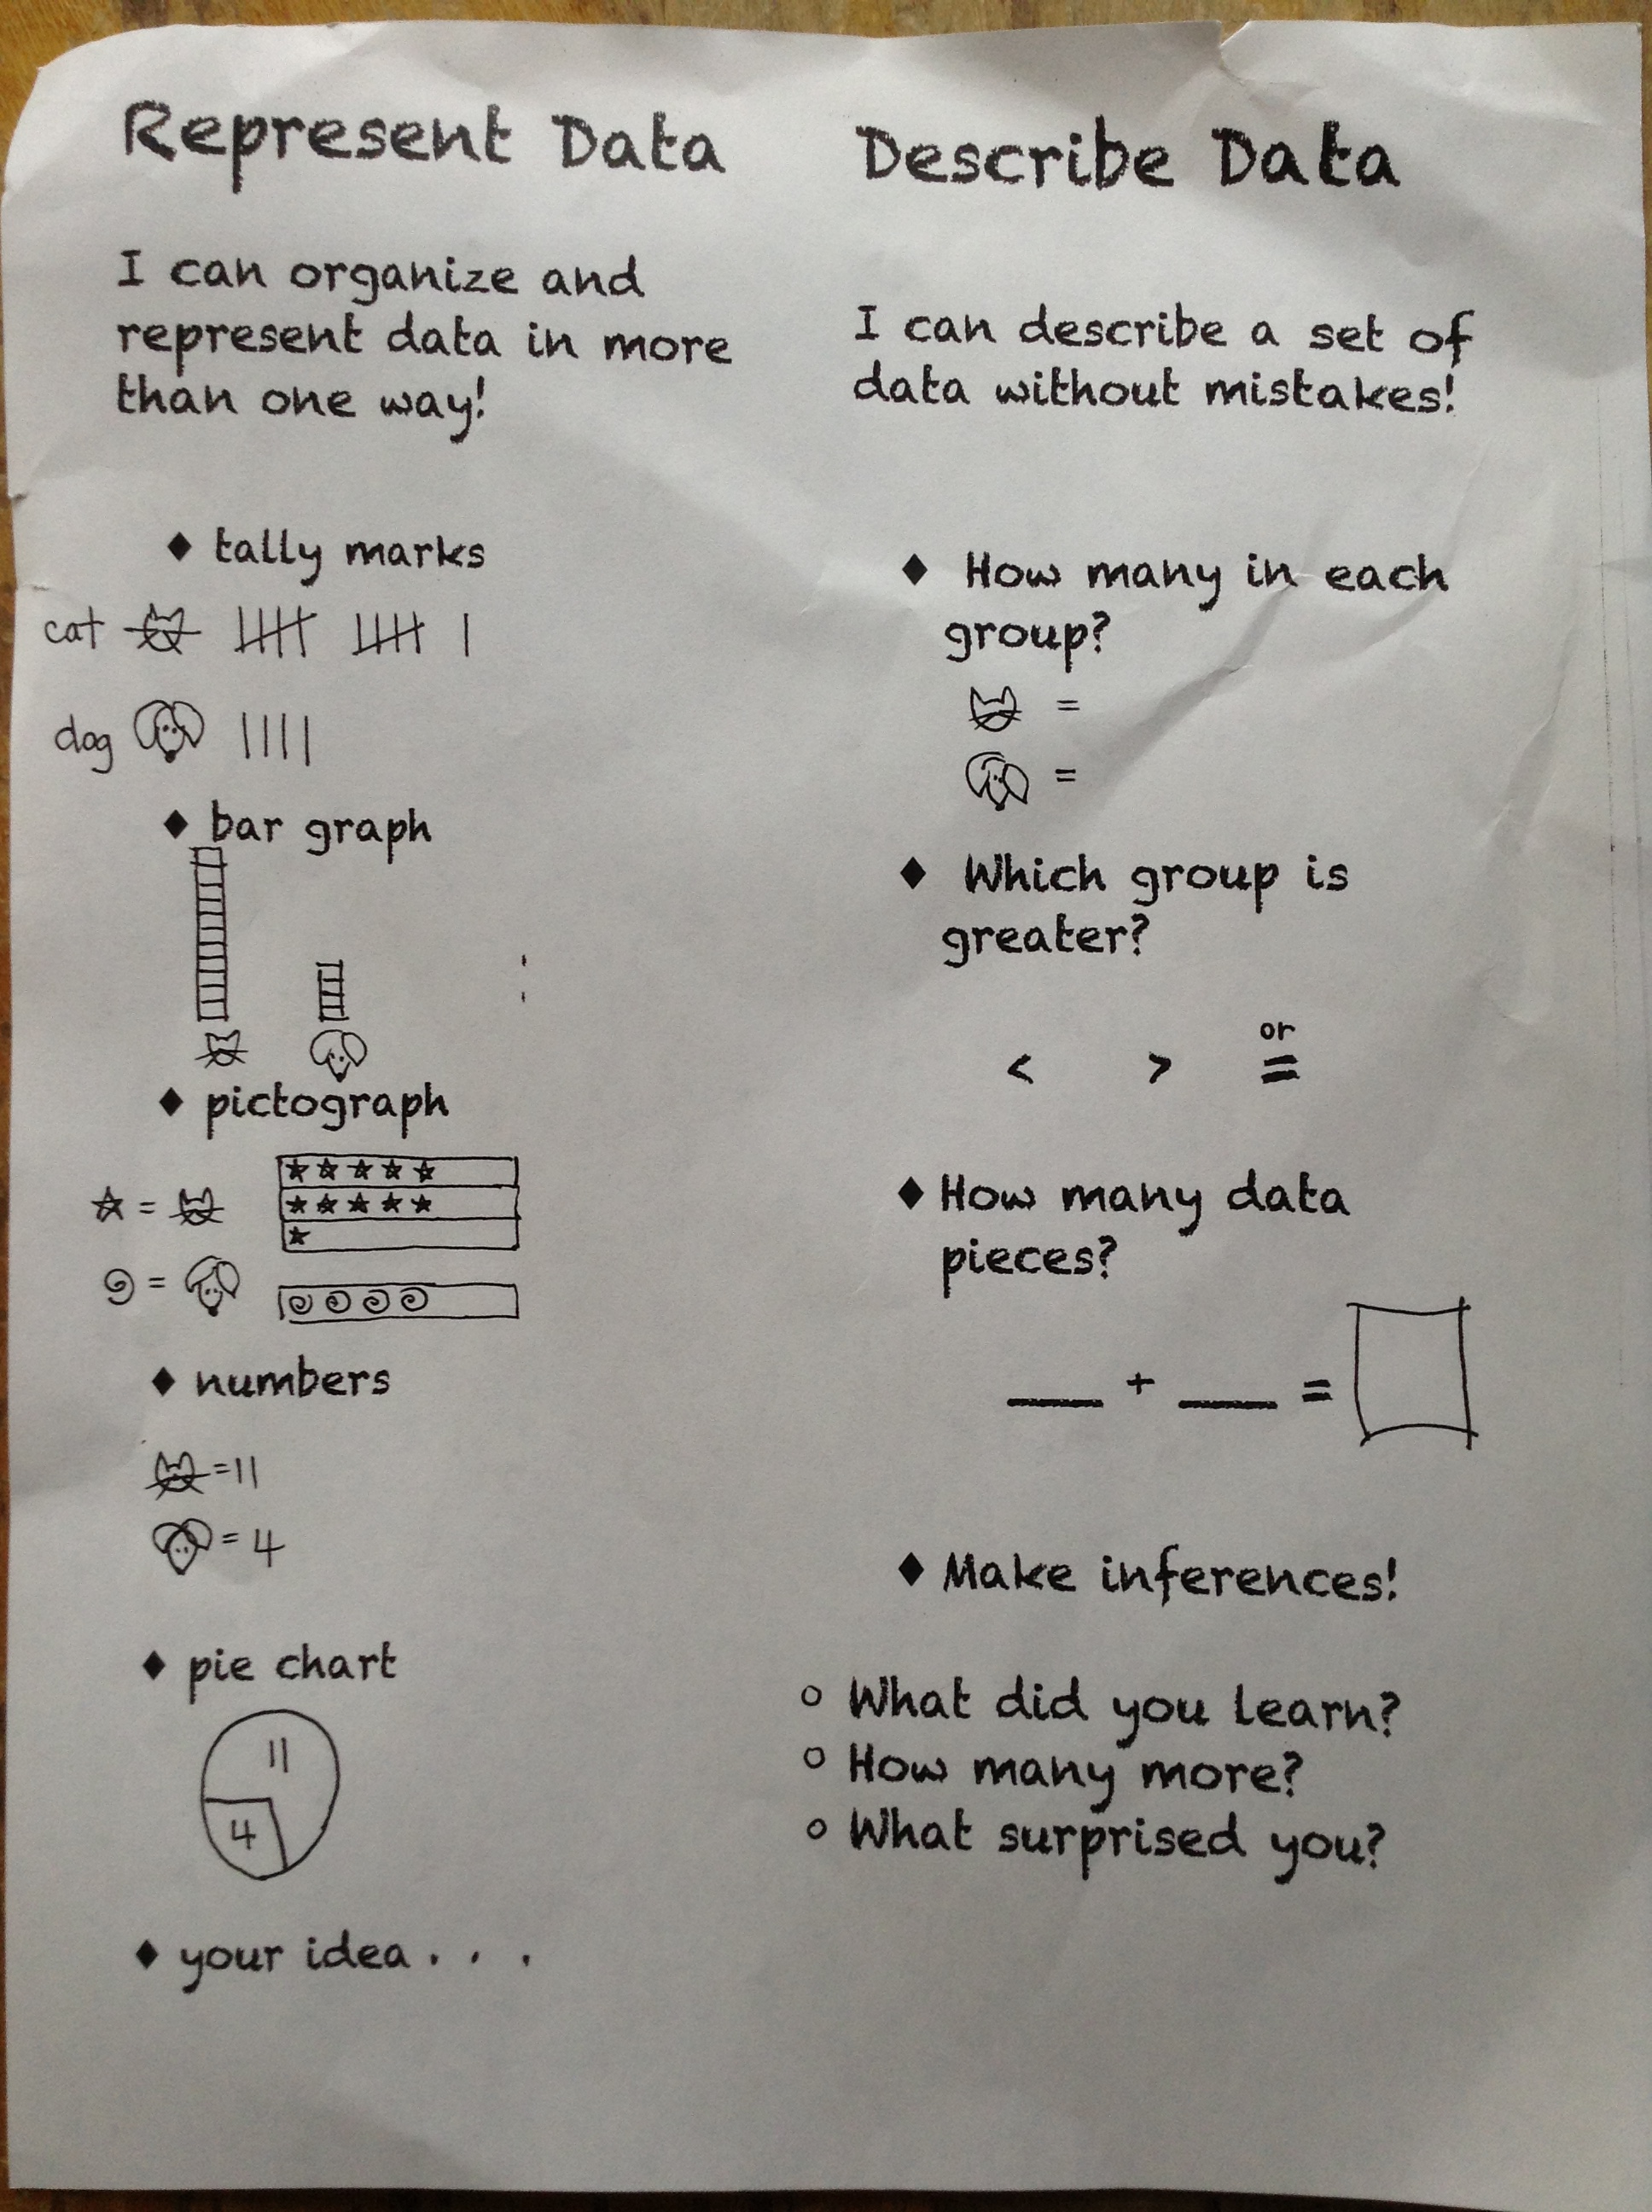
After we’d had some practice with the actual answering the question and orally analyzing the information, we started working on how to represent that information. Thanks to my friend Mrs. Appelbaum (remember her, with the AWESOME name and the great idea for webs in writing/science?), I had a really good visual to show my kids the expectations for what they should be able to do with both describing and representing data by the end of this unit:

I think the best part about this checklist is that a kiddo in her class asked her to make it so he’d remember what to do.
This checklist was the next step for us and with it we began to look at how to SHOW what the answers were, especially to people who weren’t there in our class when we took the survey (this meant that they would have to be clear and concise).
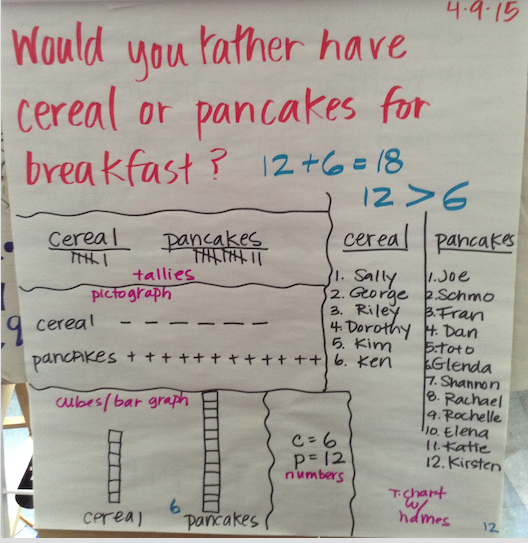
We had a go at the idea with that question about cereal and pancakes, trying it ourselves and then coming back together and trying many different ways that were on Mrs. Appelbaum’s sheet. WOW–look at all of those ways to say the same thing:
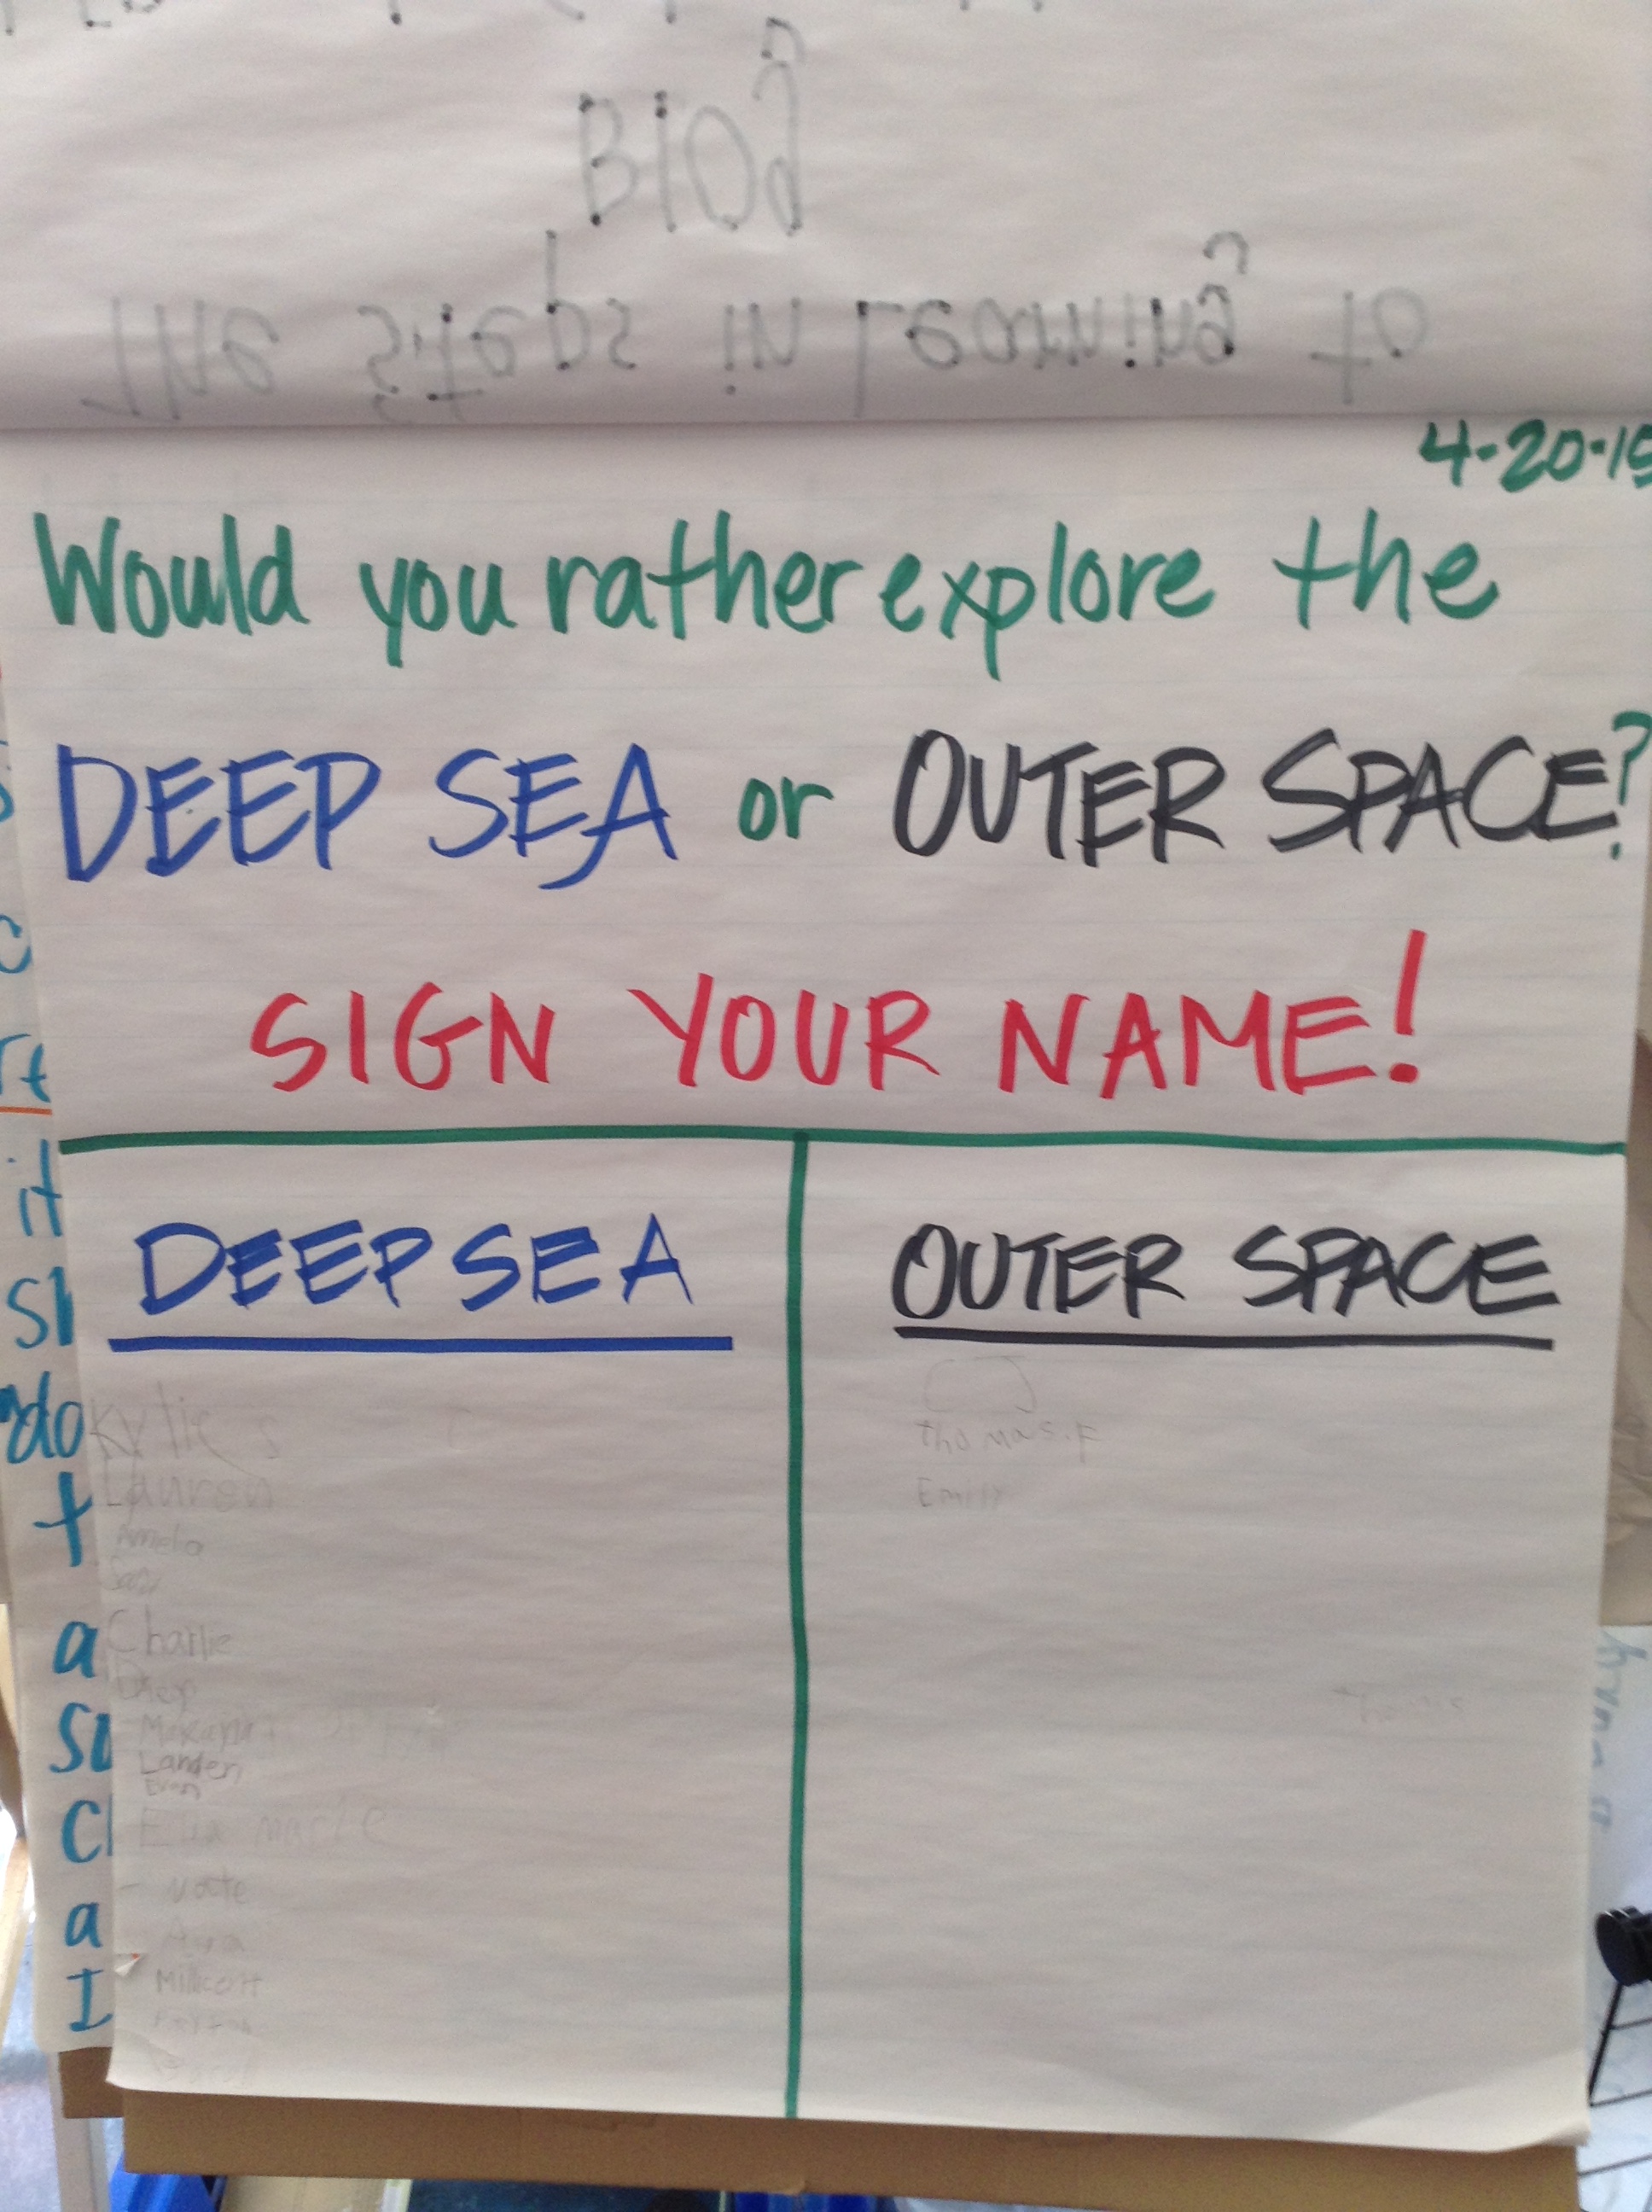
 Today’s work was really cool as 3 friends decided to start organizing it AS we were collecting it. Jacob, Lauren and Amelia made the paper into a t-chart and even put labels so kiddos would know where to put their answer:
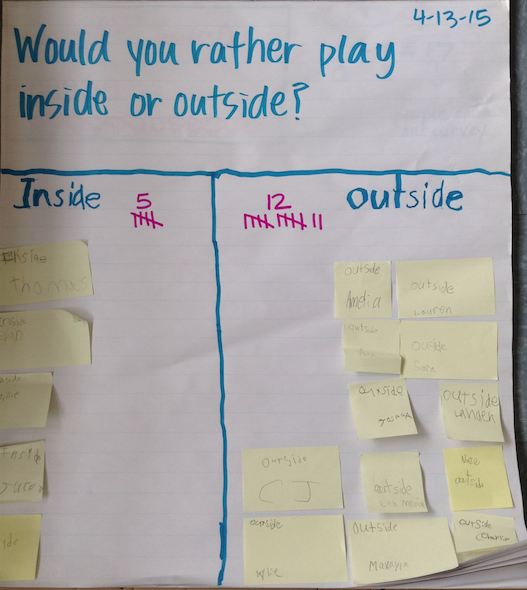
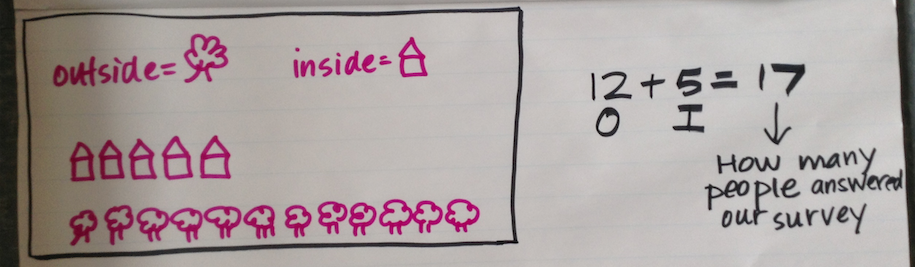
 We showed the total with both tallies and numbers, and then also tried a pictograph:
 We also talked about the part of the checklist where we make sure to show how many people took the survey, which we did by adding the totals of both columns.
Today we took a fun and important step and began to do surveys on our own! We reviewed the steps and then worked with a partner to plan the question we’d be asking, using these ideas for stems:
 Tomorrow we ask the question of our friends and start collecting data! Stay tuned for the fun! 🙂


 Wednesday
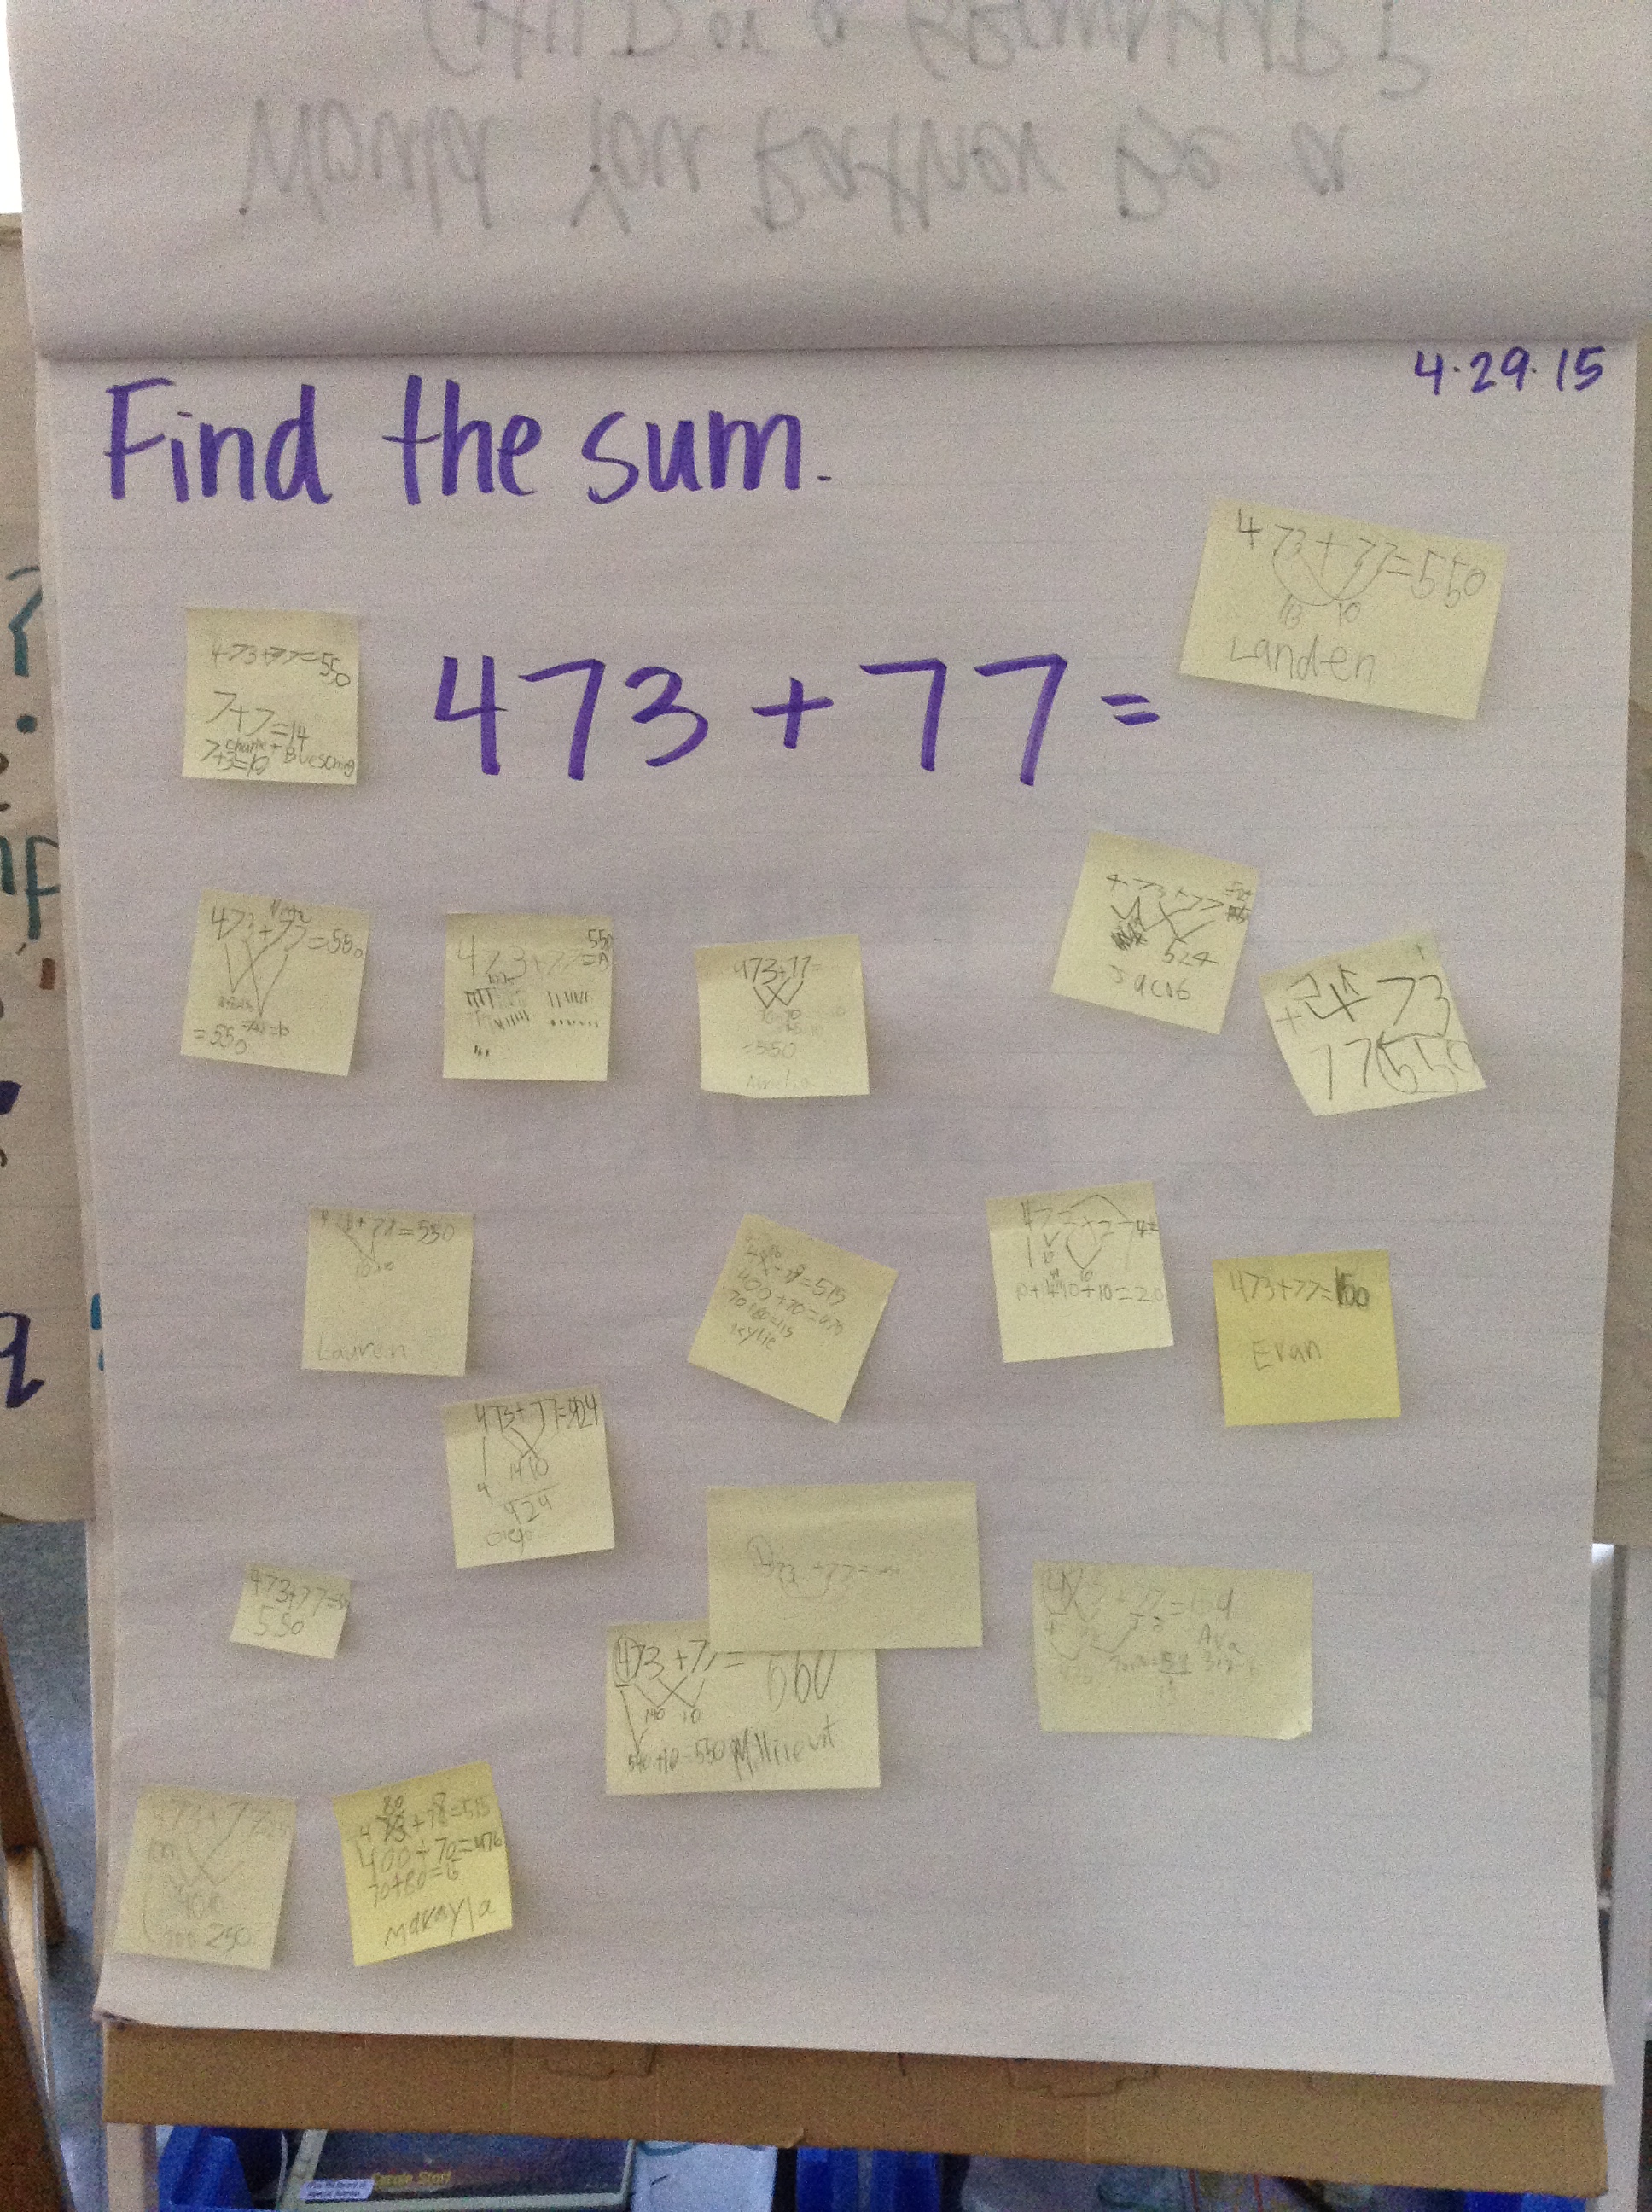 Thursday